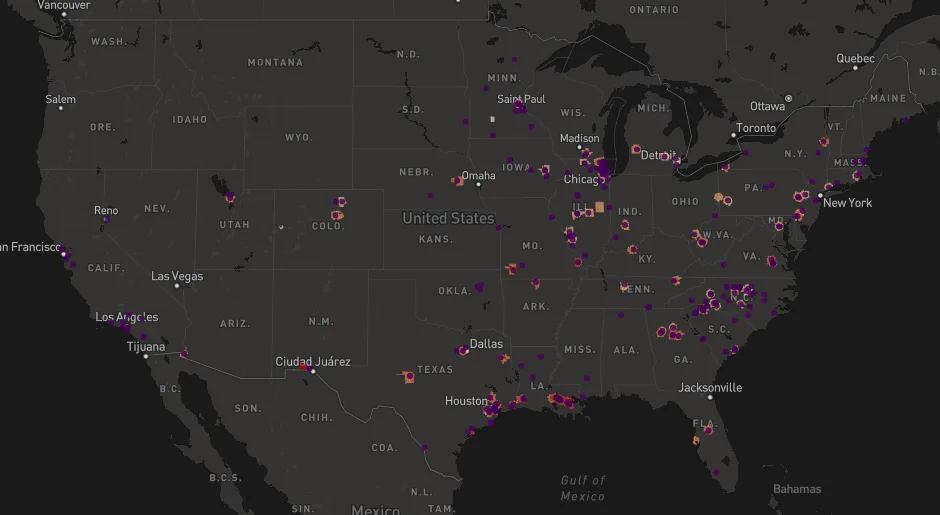
Ethylene Oxide Explorer (opens in a new tab) puts emissions reported to the Toxics Release Inventory (TRI) and EPA’s modeled cancer risks on one map. You can compare emissions between facilities and over time, and see the underlying data in a table.
Why it exists
Ethylene oxide is an industrial chemical used to make antifreeze and to sterilize medical devices and spices. It is also a carcinogen, so emissions near communities are regulated closely. It is also produced inside the body and by combustion, which makes it hard to separate what comes from industry from what everyone is already exposed to.
EPA models cancer risk at every census tract in the country from reported emissions. It has done this twice: the National Air Toxics Assessment (NATA), released in 2017 using 2014 emissions, and AirToxScreen, released in 2022 using 2017 emissions. EPA’s own viewer is slow, breaks often, and does not let you compare the two assessments. This tool brings both together.
What it does
- Maps the highest-risk census tracts from NATA and AirToxScreen.
- Shows the emitting facilities that EPA says contribute to that risk.
- Compares emissions between facilities and across years, for example your local facility against one in another state.
- Shows all of the underlying data in a table.
I have more modules planned. If you have ideas or want to collaborate, please get in touch.
Disclosure: I have been retained by clients to test and implement technologies that control ethylene oxide emissions, and I support litigation on this topic.