A drinking water contamination case can involve decades of results from many laboratories, reported in different formats, with different names for the same analyte and the same sampling point. Before anyone can analyze the data, someone has to make it one dataset. This platform does that, and then puts the result in front of the legal team and experts.
What it does
- Pulls 1,4-dioxane, VOC, and PFAS results from lab reports into one PostgreSQL database.
- Standardizes sample locations and analyte names so a result means the same thing no matter which lab reported it.
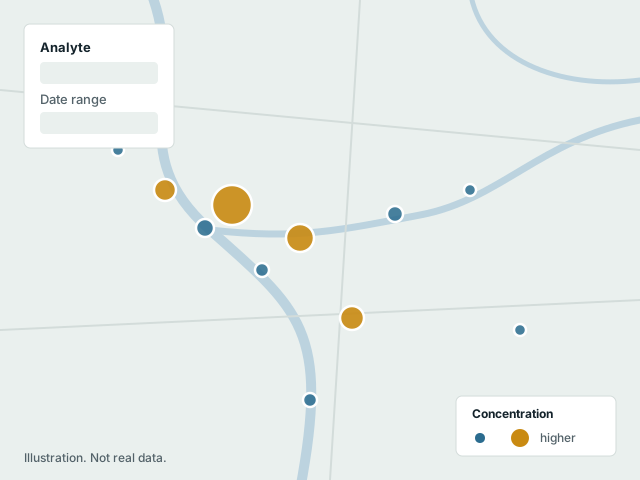
- Maps concentrations by location, with filtering by analyte, date, and source, and converts units on the fly.
- Produces summary tables and reports, and feeds the statistical work behind them, such as detection frequencies and how 1,4-dioxane tracks with co-occurring chlorinated solvents.
How it is built
A Django REST Framework back end and a React front end, with a Leaflet map. Analysis and figures are done in R against the same database, so the dashboard and the expert analysis never drift apart.
Access is limited to the client team. This page describes the tool, not the case.